
In the second section of our paper, we examined what policy makers discussed in the 1969 White House Conference. To garner some high-level insights, we used tidytext – a package developed for natural language processing in the R open-source software language – to visualize a network of textual relations in the WHC Report. This process entails cleaning and preprocessing the textual data from the WHC Report (i.e. selective lemmatization and removal of stop words), quantifying the number of unique words in the corpus, constructing bigrams based on how many times words co-occur adjacent to one another in the text, and then constructing a network of textual relations comprised of the nodes and word co-occurrences.
Before delving into those results, here are the 10 most frequently occuring words in the WHC Report:
## # A tibble: 12,779 x 2
##    word      count
##    <chr>     <int>
##  1 food       2722
##  2 nutrition  1894
##  3 programs   1518
##  4 health     1022
##  5 schools     887
##  6 education   821
##  7 national    589
##  8 panel       537
##  9 federal     454
## 10 systems     449
## # … with 12,769 more rows
Not surprisingly, we see several terms that we expected to see, including food, nutrition and health. We also see discussion of various policy initiatives in the top-10 terms (programs, schools, education, recommendation and services). The high count in these terms tell us that the WHC Report placed a great deal of importance on re-educating the public about what they were eating as well as how they were distributing to food to different populations. More specifically, the WHC Report discussed the impact that future policies would have on children - the 25th most commonly occurring term (not shown here). Now, let’s look at the top-10 most commonly occuring bigrams…
## # A tibble: 78,515 x 3
##    word1      word2     count
##    <chr>      <chr>     <int>
##  1 nutrition  education   209
##  2 schools    lunch       180
##  3 food       stamps      173
##  4 task       force       168
##  5 food       nutrition   157
##  6 washington d.c         144
##  7 food       service     139
##  8 health     education   111
##  9 nutrition  health      109
## 10 public     health      108
## # … with 78,505 more rows
While we could explain these trends, we can see those relations more clearly in the text network. In this figure, nodes represent words in the WHC Report, ties between the nodes correspond to the number of times words co-occur adjacent to each other in that text, and the weight of the ties signifies with the number of times these words co-occur together in the Report.
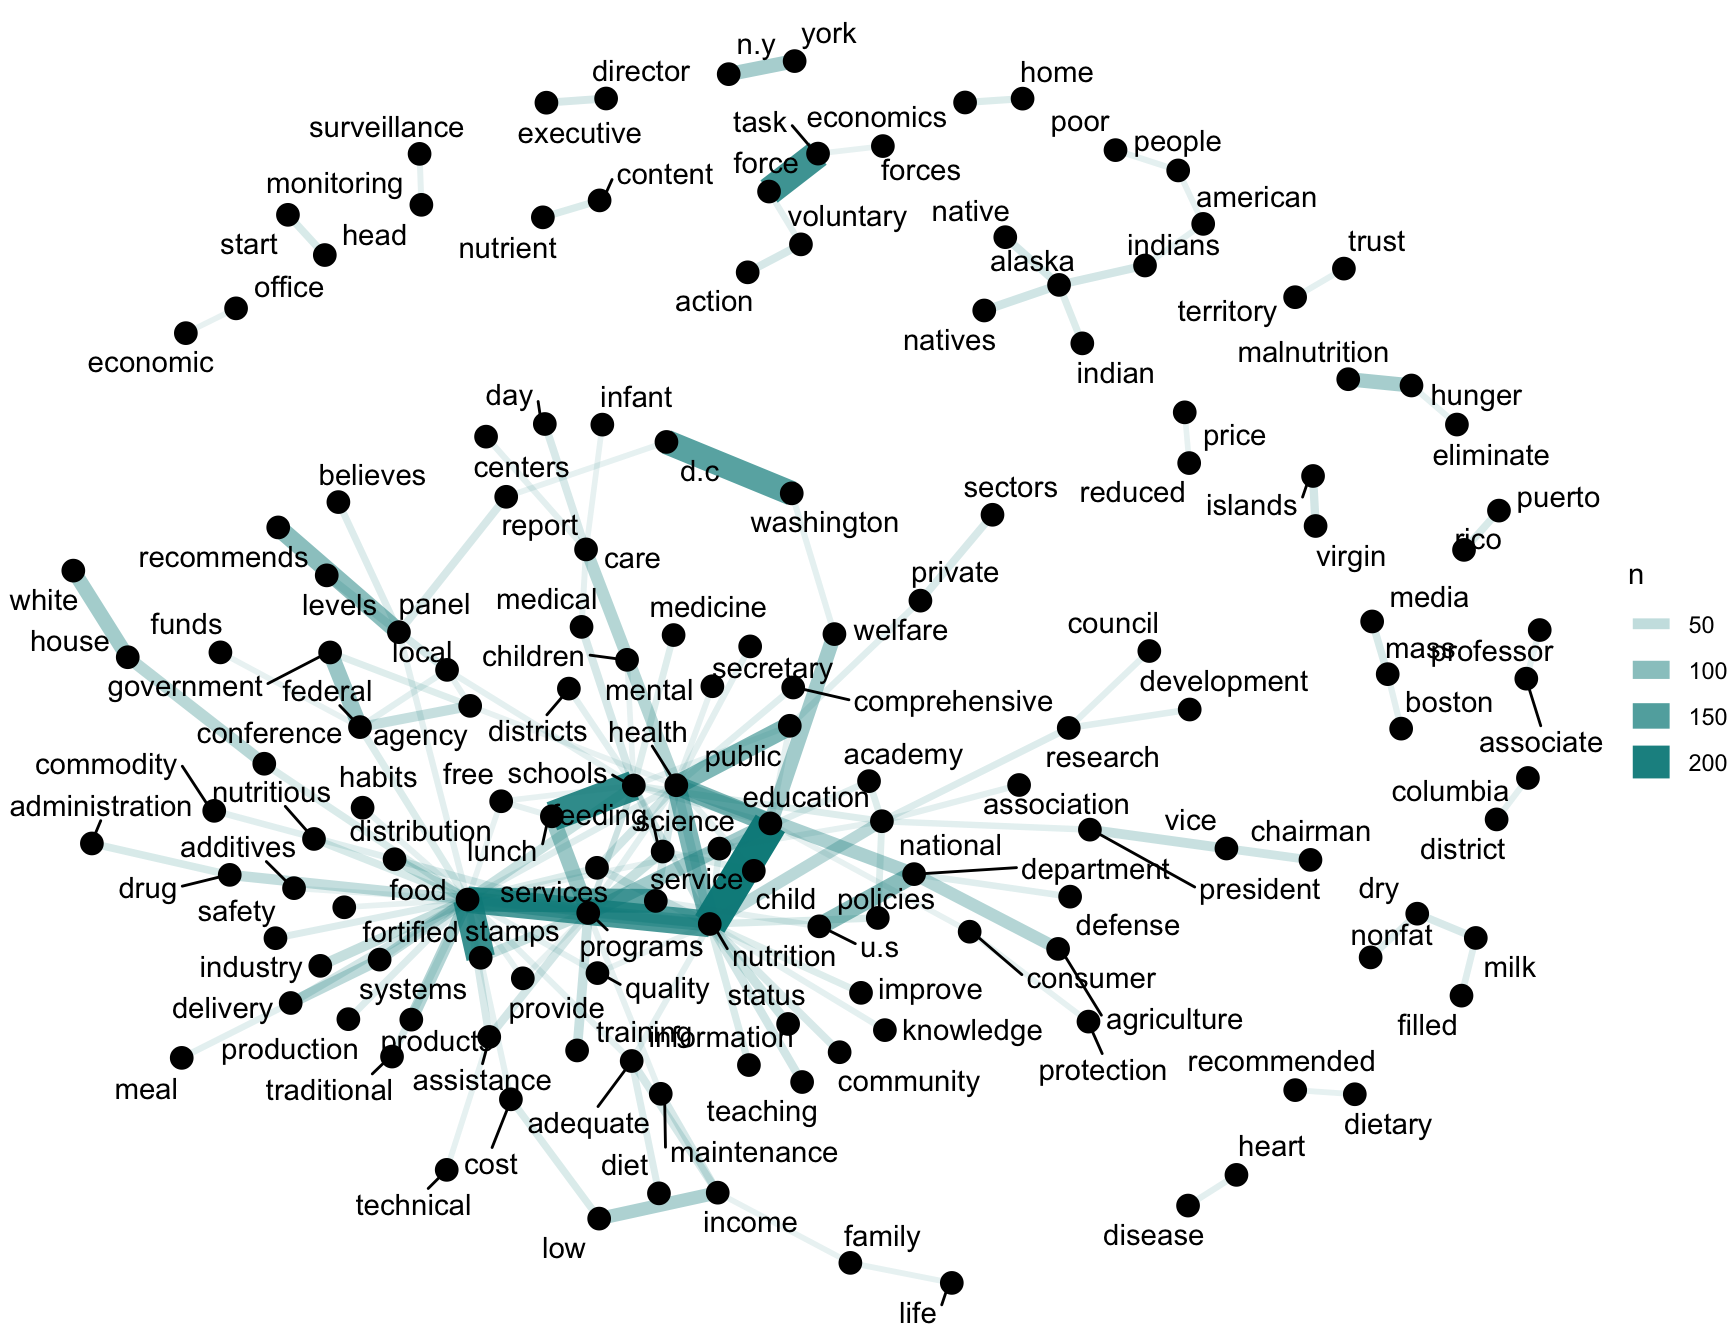
At the core of the network, the most prominent words include food, health, nutrition, school and programs. The central role of “food” in the report is not surprising, but it is quite notable that this word bridges the diverse, overlapping conceptual spheres of social programs (food-stamps, food-school-lunch-programs), food education (food-habits, food-education-programs), and food industry (food-services, food-delivery-systems, food-distribution, food-industry, food-production, fortified-food). More generally, the relations between health education (health-education, education-programs, training-programs, welfare-education, nutrition-information, nutrition-teaching, nutrition-knowledge) and the implementation of social programs centered around food, nutrition, and health. These central concepts were discussed at the conference proceedings, as evidenced by the links between the constellation of nodes at the graph’s core. A number of somewhat less central topics also surfaced, including the elimination of hunger and malnutrition (top-right) in addition to safety and regulation (surveillance-monitoring on the far right as well as food-safety and food-drug-administration on the far left). Lastly, in line with the provocations ignited by the Hunger USA documentary, there was also notable discussion of how hunger and malnutrition impacted marginalized groups like Native Americans, Alaska Natives, Puerto Ricans, Virgin Islanders, among other populations that were struggling with poverty more generally (seen at the top right of the graph).